It's not always easy to tell what is happening inside a kubernetes cluster. There are many alternatives like prometheus that can do alerting and monitoring for you. However by using AKS (Azure Kubernetes Service) you get a lot of Azure tools included. Most prominently the centralized logging with Azure Monitor.

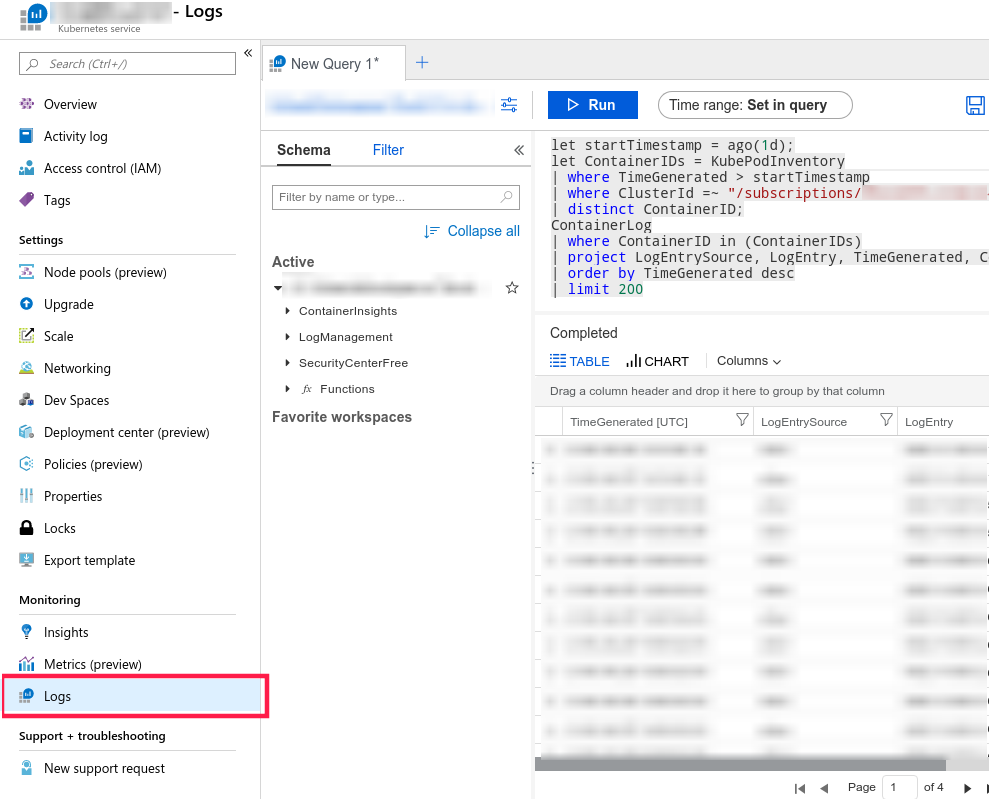
To activate an alert you first need to create a query. To create a query you'll need to go to the AKS in the Azure portal and then go to "Logs" under "Monitoring". You'll see a window that looks something like this:

It's time to write some KQL! In this query, we get all events that involves a crashing pod. If you want to retrieve all pods that have status "CrashLoopBackOff" you want to filter the events by "BackOff". "CrashLoopBackOff" basically means that the pod has crashed and tries to start the pod again.
KubeEvents
| where ClusterName =~ '<ClusterName>'
| where ObjectKind =~ 'Pod'
| where Reason =~ 'BackOff'
| project TimeGenerated, Name, ObjectKind, Reason, Message, Namespace, Count
| order by TimeGenerated desc
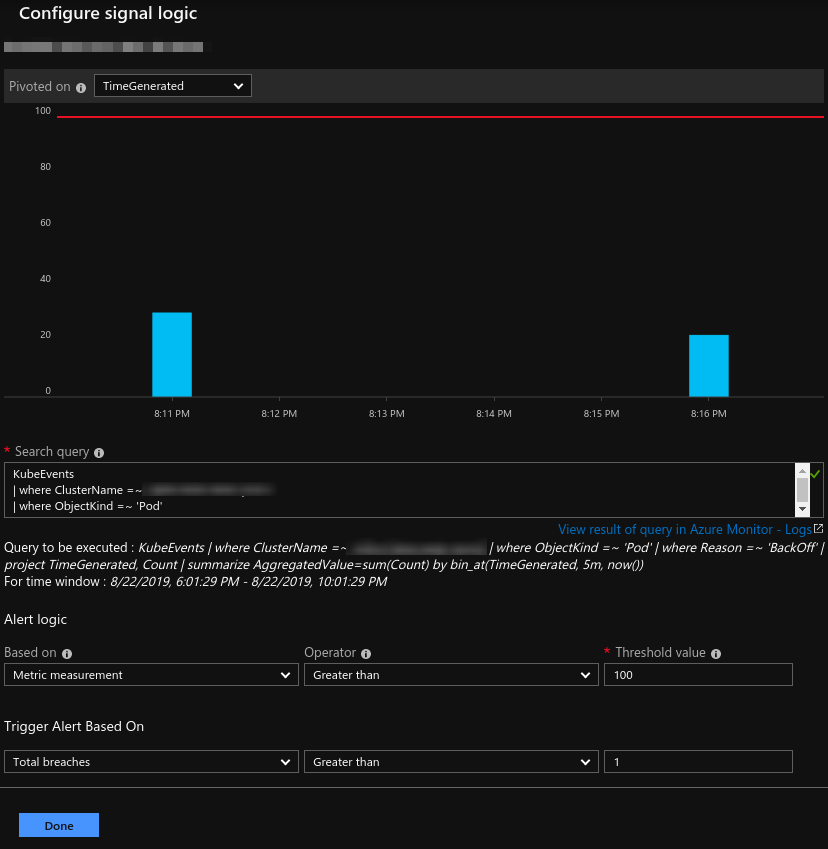
After that, you can simply create an alert rule that triggers by unhealthy pods! This need to be in the format of an aggregated value. So we need to change our query to make sure that the alert triggers. I chose to aggregate a sum of Count for every five minutes.
KubeEvents
| where ClusterName =~ '<ClusterName>'
| where ObjectKind =~ 'Pod'
| where Reason =~ 'BackOff'
| project TimeGenerated, Count
| summarize AggregatedValue=sum(Count) by bin(TimeGenerated, 5m)
Threshold with the value 100 and it would look like this image.

After that you should have an alert that triggers by "CrashLoopBackOff"! Enjoy!