In Novacare, we utilize Application Insights to monitor our applications. Application Insights uses a query language called Kusto Query Language (KQL for short). Sometimes it's hard to know what data to query. These are some queries that Novacare uses in health checking and monitoring .NET applications.
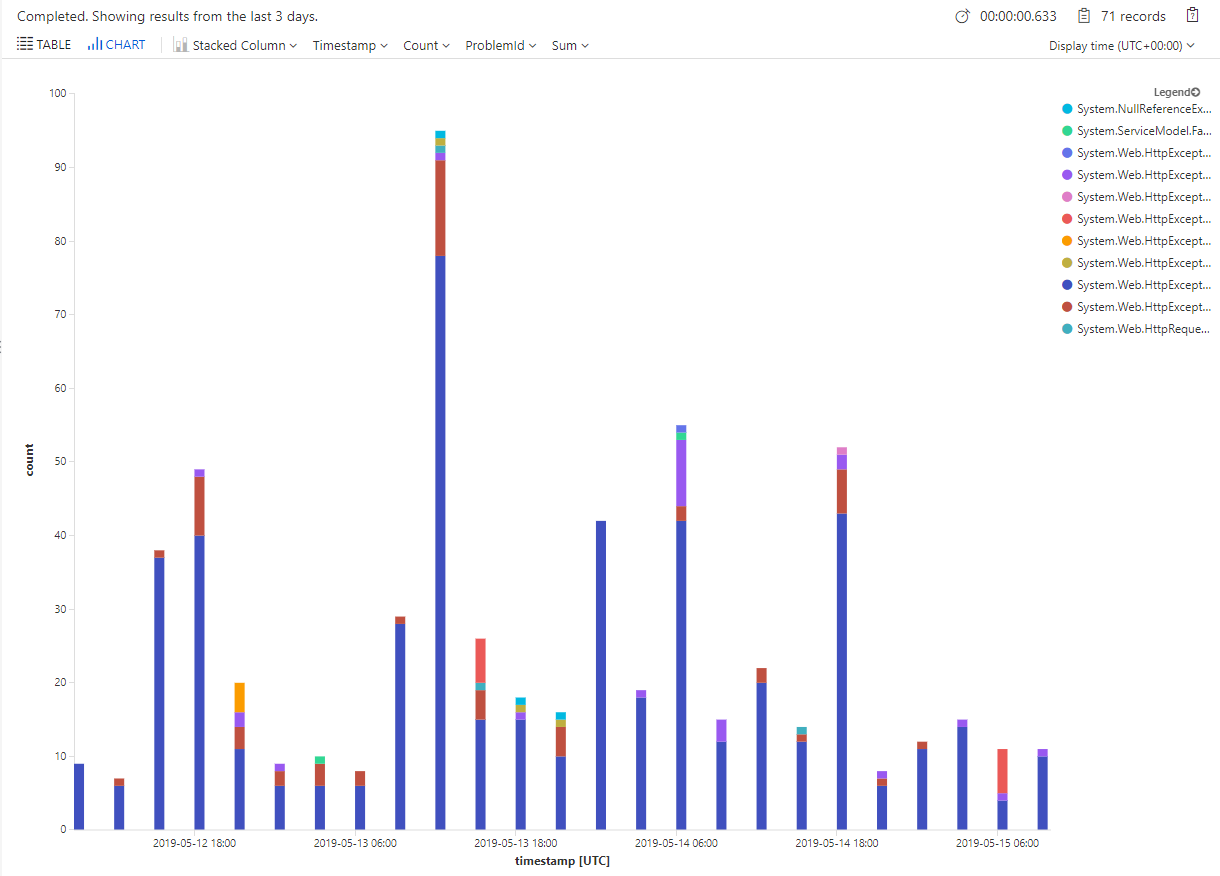
Stacked column chart of exceptions over time
Showing the volume of exceptions over time has proven to be a good indicator of the application health. Further splitting into the problemId will show the frequency of exceptions compared to each other.
exceptions
| summarize count = sum(itemCount) by bin(timestamp, 3h), problemId
| order by timestamp asc, problemId
This query is actually quite small given that it summarizes the count of exceptions, facets the exceptions into time periods of three hours and facets the exceptions by problemId. The "order by" clause will just order the facets by the correct datestamp. Here's an image of what this looks like in one of our applications:
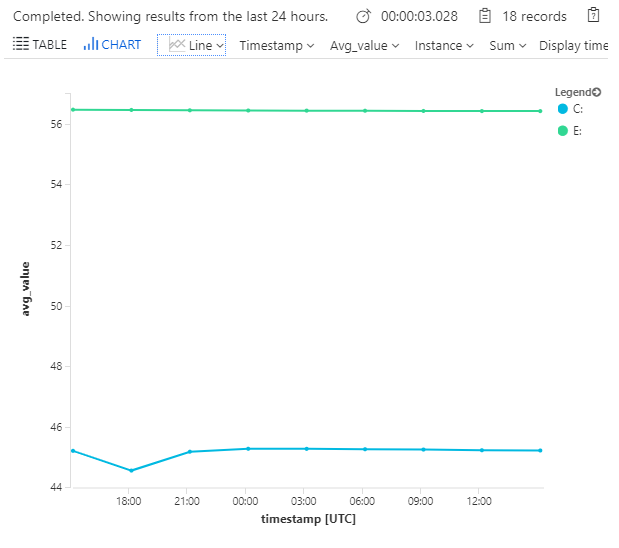
Line chart of disk space available by drive
This query requires that the application does some additional performance logging. To enable performance monitoring you need add the AppPool user to Performance Monitor Users. Press Win+R keys to open Run, type lusrmgr.msc -> Local Users and Groups -> Groups -> Performance Monitor Users -> Add
To enable disk space logging add the following <Counters> section to ApplicationInsights.config. Note that logging won't work if disk is not present. The logging in the example below won't work if there is no D-disk present on the server.
Create one <Add> for each disk on the server.
<ApplicationInsights>
    <TelemetryModules>
        <Add Type="Microsoft.ApplicationInsights.Extensibility.PerfCounterCollector.PerformanceCollectorModule, Microsoft.AI.PerfCounterCollector">
            <Counters>
                <Add PerformanceCounter="\LogicalDisk(C:)\% Free Space" ReportAs="Disk free space" />
                <Add PerformanceCounter="\LogicalDisk(E:)\% Free Space" ReportAs="Disk free space" />
            </Counters>
        </Add>
    </TelemetryModules>
</ApplicationInsights>
After adding that to your application, you'll be able to run this query:
performanceCounters
| where name startswith "Disk free space"
| summarize avg(value) by bin(timestamp, 3h), instance
| order by timestamp asc
The query will show a line chart with the percentage of free space for every three hours.
Line chart for CPU usage on all machines
Visualizing for load balanced environments can be tricky. This query will show one line per machine. Faceting by cloud_instance also works for other performanceCounters.
performanceCounters
| where category == 'Processor'
| where counter == '% Processor Time'
| where instance == '_Total'
| summarize avg(value) by bin(timestamp, 3h), cloud_RoleInstance
| order by timestamp asc
This makes it easy to compare the different loads on the different machines.
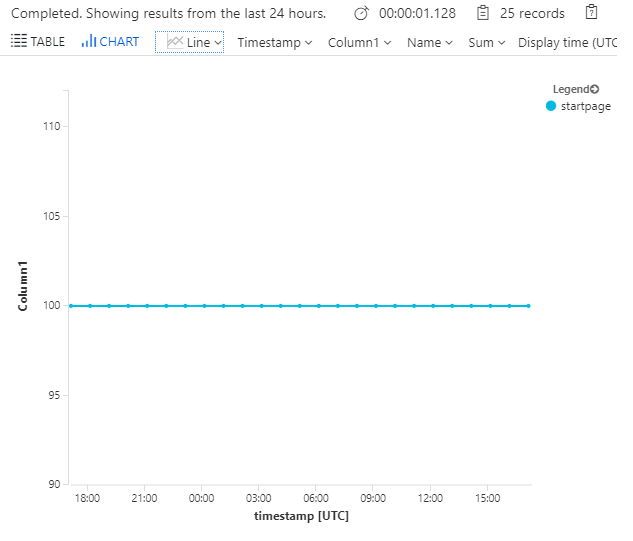
Uptime - visualized as a line chart
Once you have enabled availability tests in Application Insights, you can query the tests by getting the average value of the success log and converting to percentage per hour.
availabilityResults
| summarize avg(toint(success)) * 100 by bin(timestamp, 1h), name
| order by timestamp asc
Here's a graph showing a single line per test, only one line in my example.
These are just some of the possibilities that you can utilize with AI and KQL. I hope that you enjoyed this post!