I’ve worked with many different Application Performance Management (APM) services over the years, and switching between them has always been tedious. I’m glad that there’s now a dedicated standard that makes switching between different tools less of a headache.
There are many ways to export data from OpenTelemetry to various systems. I’ll show some examples in .NET using Application Insights as the APM service, although the principles apply everywhere.
Export to the APM directly from the service
OpenTelemetry offers exporters of many kinds, including for Azure Monitor and Application Insights. You can do this easily using the .UseAzureMonitor() method from the Azure.Monitor.OpenTelemetry.AspNetCore NuGet package.
// Import the Azure.Monitor.OpenTelemetry.AspNetCore namespace.
using Azure.Monitor.OpenTelemetry.AspNetCore;

var builder = WebApplication.CreateBuilder(args);

// Add OpenTelemetry and configure it to use Azure Monitor.
builder.Services.AddOpenTelemetry().UseAzureMonitor();

var app = builder.Build();
app.Run();
Make sure to set the environment variable containing the connection string: APPLICATIONINSIGHTS_CONNECTION_STRING=<Your connection string>.
This works for most simple cases.
However, there are a few drawbacks to this approach when building distributed applications:
- When using secret-less connection strings and Managed Identities, each service’s identity needs a role assignment to send the data to Application Insights.
- The code targets Azure Monitor directly as a hard dependency, meaning each service will connect to Application Insights, increasing network traffic.
Export to OpenTelemetry collector and proxy data to any APM in a distributed application scenario
A slightly more elegant, albeit more involved, approach follows the same general principle.
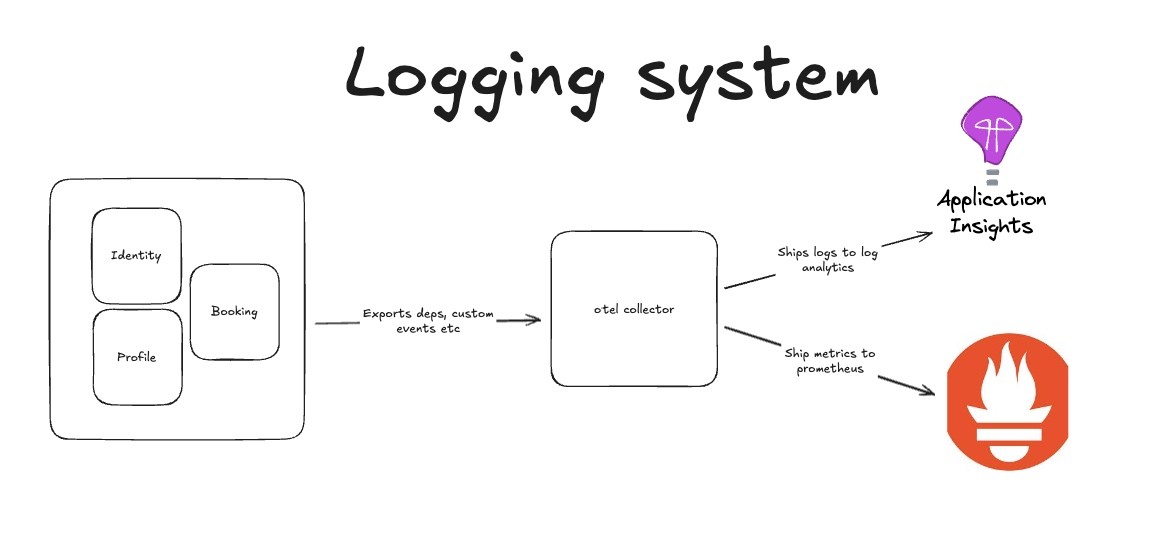
The OpenTelemetry collector will work as a proxy for all telemetry data. It contains the configuration that routes data to the correct dependencies.
This allows you to work with multiple APMs and control which data types are sent where.
We’ll use the otel/opentelemetry-collector-contrib image. I’ll set this up in AKS, but the same principles apply to other containerized environments.
apiVersion: apps/v1
kind: Deployment
metadata:
  name: otel-collector
spec:
  replicas: 1
  selector:
    matchLabels:
      app: otel-collector
  template:
    metadata:
      labels:
        app: otel-collector
    spec:
      serviceAccountName: service-account-for-federated-identity
      containers:
        - name: otel-collector
          image: otel/opentelemetry-collector-contrib:latest
          args: ["--config=/conf/otel-collector-config.yaml"]
          env:
            - name: KUBE_NODE_NAME
              valueFrom:
                fieldRef:
                  fieldPath: spec.nodeName
          resources:
            requests:
              cpu: 100m
              memory: 128Mi
            limits:
              cpu: 500m
              memory: 512Mi
          volumeMounts:
            - name: config
              mountPath: /conf
            - name: varlog
              mountPath: /var/log
      volumes:
        - name: config
          configMap:
            name: otel-collector-config
        - name: varlog
          hostPath:
            path: /var/log

---

apiVersion: v1
kind: Service
metadata:
  name: otel-collector
spec:
  ports:
    - name: otlp-grpc
      port: 4317
      targetPort: 4317
  selector:
    app: otel-collector

---

apiVersion: v1
kind: ConfigMap
metadata:
  name: otel-collector-config
data:
  otel-collector-config.yaml: |
    receivers:
      otlp:
        protocols:
          grpc:
            endpoint: 0.0.0.0:4317

    processors:
      attributes:
        actions:
          - key: log.severity
            action: insert
            from_attribute: severity_text
      batch:
      memory_limiter:
        check_interval: 5s
        limit_mib: 400
        spike_limit_mib: 50
    exporters:
      azuremonitor:
        custom_events_enabled: true
        connection_string: "<Your connection string>"
    service:
      pipelines:
        traces:
          receivers: [otlp]
          processors: [batch]
          exporters: [azuremonitor]
        metrics:
          receivers: [otlp]
          processors: [batch]
          exporters: [azuremonitor]
        logs:
          receivers: [otlp]
          processors: [memory_limiter, batch, attributes]
          exporters: [azuremonitor]
This YAML specifies a Kubernetes implementation of the OpenTelemetry Collector, which exports telemetry data to Azure Monitor after receiving it via OTLP/gRPC.
- It connects a Service Account for Azure federated identity authentication.
- Port 4317 is open to OTLP traffic by a service. The configuration of the collector is provided by the ConfigMap, which specifies Azure Monitor exporters for traces, metrics, and logs, OTLP receivers, and processors (for batching, memory limiting, and attribute enrichment).
This setup enables centralized telemetry collection and forwarding from Kubernetes workloads to Azure Monitor via OpenTelemetry.
In .NET, you can define .AddOtlpExporter() and point it to the collector using the OTEL_EXPORTER_OTLP_ENDPOINT environment variable:
services.AddOpenTelemetry()
	.WithLogging(logger => logger
		.AddOtlpExporter(o =>
		{
			o.Endpoint = new Uri(context.Configuration["OTEL_EXPORTER_OTLP_ENDPOINT"]);
		}))

	.WithTracing(tracer => tracer
		.AddAspNetCoreInstrumentation()
		.AddHttpClientInstrumentation()
		.AddOtlpExporter(o =>
		{
			o.Endpoint = new Uri(context.Configuration["OTEL_EXPORTER_OTLP_ENDPOINT"]);
		}))

	.WithMetrics(metrics => metrics
		.AddAspNetCoreInstrumentation()
		.AddHttpClientInstrumentation()
		.AddOtlpExporter(o =>
		{
			o.Endpoint = new Uri(context.Configuration["OTEL_EXPORTER_OTLP_ENDPOINT"]);
	}));
I believe this approach allows us to swap out underlying dependencies and tools with ease. The proxy (collector) becomes the central unit responsible for routing telemetry data efficiently.