Some of the more difficult exceptions to debug are those thrown deep inside-third party frameworks. Everybody knows you can decompile a dll and look at the source code, but that can only take you so far. Wouldn't it be great if you could set a breakpoint in that decompiled code and step through it at run time? Turns out you can, and it's pretty easy!
1. Turn off "Enable Just My Code" in Visual Studio
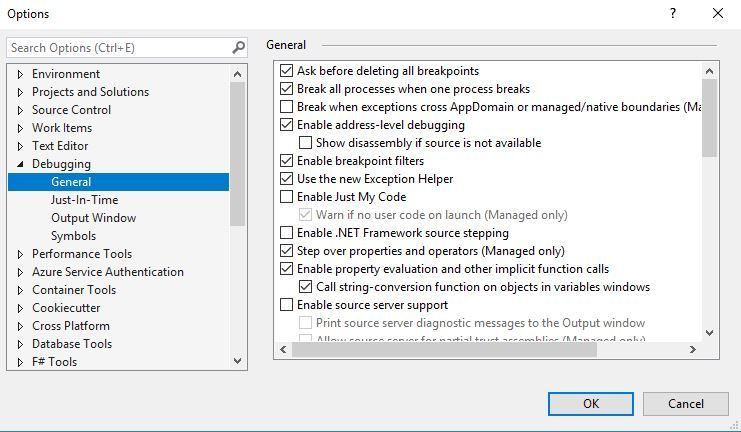
The default settings in Visual Studio won't allow you to step into a third-party dll in debug mode, but this is easily fixed.
Just go to Options -> Debugging -> uncheck "Enable Just My Code"
If you have ReSharper installed this may be enough to get debugging working.
If you don't have ResHarper or if you can't get the ReSharper way to work, keep reading.
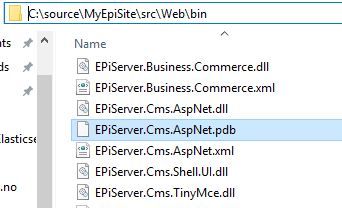
2. Put the Pdb-file of the dll in question into your /bin folder
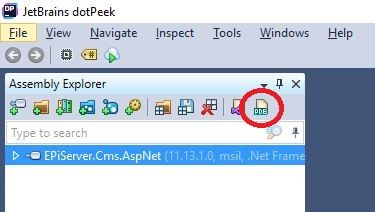
"But Sigve, I don't have a PDB-file to my third-party dll" I hear you say. Not to worry, using JetBrain's dotPeek we can generate one. Just open the dll in dotPeek, click the "Generate Pdb" icon and copy the generated file to the /bin-directory of your application next to the dll in question.
3. Get your debug on
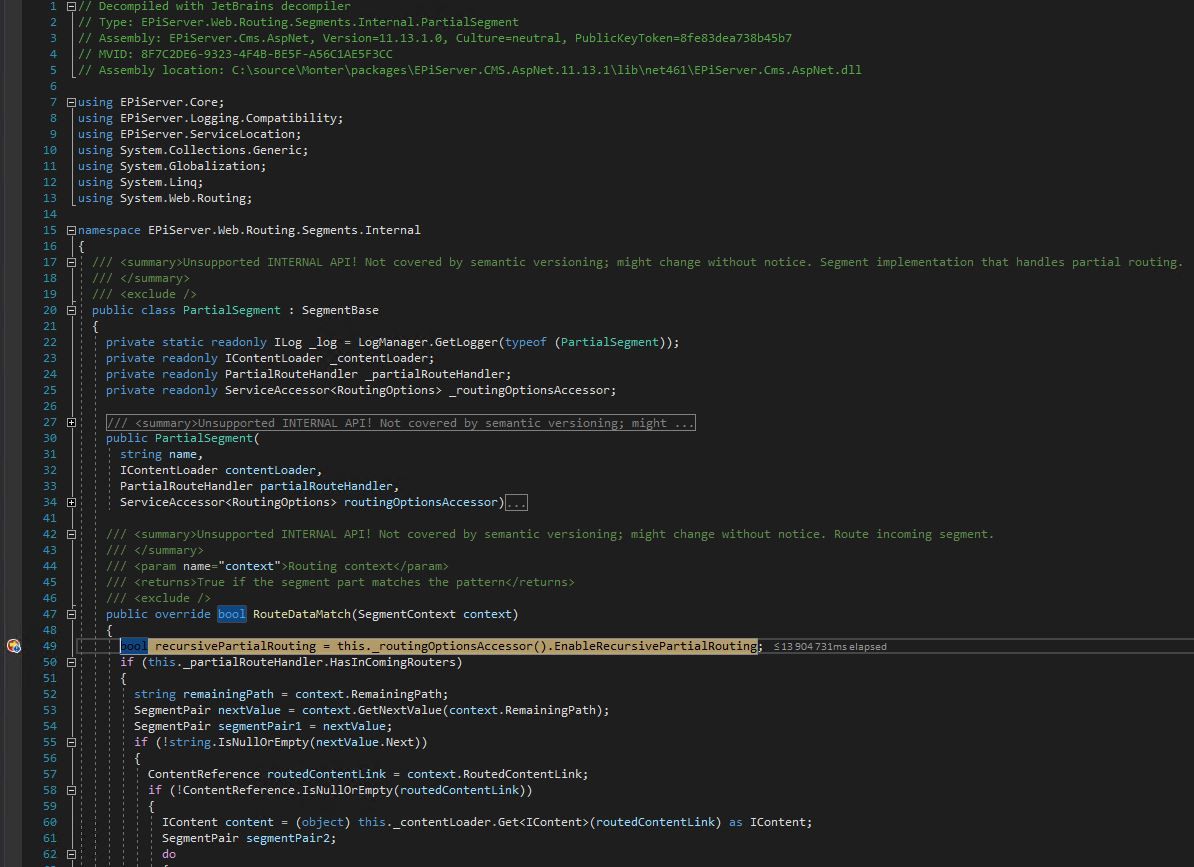
In Visual Studio, navigate to the decompiled code in question and set your breakpoint, fire up the old debug mode and enjoy the power of stepping through third-party code.
Here is an example of me debugging into Episerver's EPiServer.Cms.AspNet.dll