I spent a morning using Claude Code to triage production issues — read the telemetry, figure out what was broken, and file the tasks in Azure DevOps. It worked better than I expected.
The session boiled down to three things: querying Application Insights with the Azure CLI, checking Service Bus dead letter queues, and pushing user stories into ADO. One terminal, no portal tabs, no copy-pasting error messages into tickets.
How Claude Code runs this
No Azure plugin, no MCP server. Claude Code has a bash tool that runs shell commands in your terminal, and that's all it needs. If you're logged in with az login, Claude can run any az command, read the output, and chain the next one based on what it finds.
The other two tools that matter are read (opens source files from the repo) and grep (finds the right file). Shell access plus file system access is what makes the cross-referencing work. It's not querying some indexed knowledge base. It's literally running grep across your codebase and reading the handler file, same as you would.
You give it a starting point like "look at the DLQ for the service bus" and it works forward from there.
I had three custom skills going into this session. Two for the specific services (App Insights and Azure DevOps), and one to chain them together for triage.
The App Insights skill
Application Insights has a full KQL query interface through az monitor app-insights query. The problem is the boilerplate: you need the resource name, resource group, subscription, and AppId on every call, and the output comes back as a JSON table that needs parsing before it's readable. My skill handles all of that.
---
name: azure-app-insights
description: Search Azure Application Insights logs, traces, exceptions,
  requests, and dependencies for the production environment. Use this skill
  whenever the user wants to investigate production issues, search logs, look
  up errors or exceptions, check request performance, trace dependencies, or
  query Application Insights data.
---

## Resource Details

- **App**: appi-prd-myapp-shared
- **Resource Group**: rsg-prd-myapp-shared
- **Subscription**: prd-mysubscription

## Finding the AppId

az monitor app-insights component show \
  --query "[?contains(name,'appi-prd-myapp')].{name:name, appId:appId}" \
  -o json \
  --subscription "prd-mysubscription"

## Running Queries

az monitor app-insights query \
  --app appi-prd-myapp-shared \
  --resource-group rsg-prd-myapp-shared \
  --subscription prd-mysubscription \
  --analytics-query "<KQL>" \
  --offset 1h \
  -o json 2>/dev/null | python3 -c "
import sys, json
data = json.load(sys.stdin)
table = data['tables'][0]
cols = [c['name'] for c in table['columns']]
print('\t'.join(cols))
for row in table['rows']:
    print('\t'.join(str(v) if v is not None else '' for v in row))
"

The Python pipe at the end turns the JSON table format into tab-separated
output that's actually readable. Without it, Claude has to parse nested
arrays of arrays on every query.

## Tips

- Always add `| take N` to avoid pulling too much data.
- Use `| project` to select only relevant columns.
- When the query is vague, start broad (search traces + exceptions)
  and narrow down based on what you find.
With this skill loaded, "check exceptions for the last 24 hours" is enough. Claude doesn't ask for the subscription or resource group. It just runs the query.
The ADO skill
This one knows the org, project, area paths, iteration structure, and how to resolve which area a task belongs under. It also enforces a workflow: check for duplicates before creating, investigate the code before writing the description, write everything in Norwegian, and confirm with you before filing.
---
name: azure-devops-task
description: Create, update, and manage tasks in Azure DevOps. Use this skill
  whenever the user wants to add a task, create a work item, log work, track a
  bug, file a ticket, update an existing task, or manage backlog items in ADO.
---

## Project Details

- **Organization**: https://dev.azure.com/my-org
- **Project**: MyProject
- **Default Iteration**: `MyProject\MyTeam`
- **Default Area Root**: `MyProject\MyProduct`

## The CLI command

az boards work-item create \
  --type "User Story" \
  --title "Your title here" \
  --description "<h2>Background</h2><p>...</p>" \
  --area "MyOrg\MyProject\MyArea" \
  --fields "System.Tags=AI" \
  -o json

Always include `System.Tags=AI` so these items are easy to filter
and review before grooming.

## Workflow

### 1. Resolve the Area Path

Pick the area under `MyProject\MyProduct` that best matches the subject:

| Area | Matches topics about |
|---|---|
| Booking | Reservations, availability |
| Identity | Authentication, authorization, login |
| Payment | Payment processing |
| Monitoring | Observability, alerting, health checks |
| Architecture | Infrastructure, cross-cutting concerns |
| ... | (remaining areas for your domain) |

If the topic doesn't clearly match any area, use `Architecture` as fallback.

### 2. Check for Duplicates

Before creating, search for existing work items with similar titles.
If you find a match that is New or Active: update it. If Done: create new.

### 3. Investigate the Code

Before writing the task, look at the relevant source code:
- Grep for the exception type or error message
- Read the code around the match to understand root cause
- Include specific files and suggested fix in the description

### 4. Write the Content

Title: Short, action-oriented.
Description: HTML with background, suggested fix, acceptance criteria.

### 5. Confirm, Create, Report Back

Present a summary and wait for approval. Tag with `AI`.
After creating, show the work item ID and a direct link.
You say "create a task for this" and it resolves the area, checks for duplicates, reads the code, writes the description, and asks for confirmation.
Reading the Service Bus DLQ
The Azure CLI gives you DLQ counts and queue config in two calls:
az servicebus queue list \
  --namespace-name "sb-prd-myapp" \
  --resource-group "rsg-prd-myapp" \
  --subscription "my-subscription" \
  --query "[].{name:name, dlq:countDetails.deadLetterMessageCount, active:countDetails.activeMessageCount}" \
  -o table
az servicebus queue show \
  --namespace-name "sb-prd-myapp" \
  --resource-group "rsg-prd-myapp" \
  --subscription "my-subscription" \
  --name "sbq-prd-myqueue" \
  --query "{lockDuration:lockDuration, maxDelivery:maxDeliveryCount}" \
  -o json
Cross-reference the exception type from App Insights with the lock duration from the queue config. Neither tells you much on its own — but together they can pinpoint why messages are ending up in the DLQ.
The skill that ties App Insights, code and ADO together
This was the part that actually mattered. The useful skill was not "query App Insights" or "create a DevOps task" on their own. Claude can already do both. What I needed was the bit in the middle: the cross-referencing and triage.
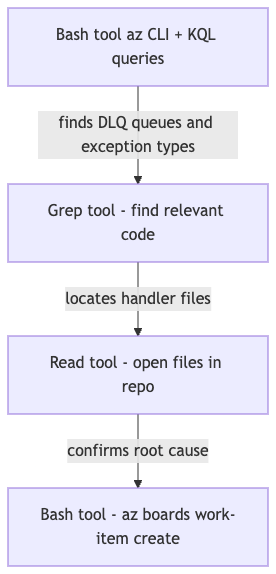
Getting that right manually takes a bit of prompt work. You start with DLQ counts, find the matching cloud_RoleName in App Insights, query exceptions for that role, check dependency durations against lock windows, then read the handler code to confirm the theory. Step by step it works, but you keep nudging Claude back onto the rails.
The triage skill gives it a default way to think through that whole sequence.

The whole thing works because the Azure CLI, App Insights KQL, and the file system are all in the same shell session. Claude jumps between them. You don't have to.
With the skill in place, a prompt like "triage the latest failures for this service and file what needs fixing" is enough.
The description tells Claude when to load it. The body is the actual workflow:
---
name: production-triage
description: Investigate production issues by correlating Azure Application
  Insights telemetry, the local codebase, and Azure DevOps work items. Use
  this whenever the user asks to triage errors, exceptions, failed
  dependencies, DLQ issues, or recurring incidents and the task may require
  moving between App Insights, source code, and ADO to identify root cause
  and create or update actionable work items.
---

## Triage workflow

### 1. Gather signals

Use the azure-app-insights skill to query production telemetry.
Start broad, then narrow:

1. Exceptions — `exceptions | where timestamp > ago(24h)`
2. Failed requests — `requests | where success == false`
3. Failed dependencies — `dependencies | where success == false`

Group by `cloud_RoleName`, `outerType`, and operation name to find
patterns. If a specific service or queue is mentioned, filter on that
first.

### 2. Identify the code path

Use `cloud_RoleName` and the exception type to find the relevant
service in the local codebase:

- Grep for the exception type or error message
- Read the handler, consumer, or controller that matches
- Check configuration (lock durations, timeouts, retry policies)

Don't suggest a fix until you've read the code.

### 3. Correlate across services

If the issue involves messaging (Service Bus, Event Hub):

- Check DLQ counts on the relevant queues/topics
- Compare queue lock duration against handler execution time
- Check dependency call durations from App Insights

If the issue involves HTTP dependencies:

- Check the downstream service's request logs for the same time window
- Compare caller-side dependency duration with callee-side request duration

### 4. Assess severity

Before filing anything, answer:

- Is this a new issue or a known/expected pattern?
- Is it actively affecting users or just noisy telemetry?
- Is the evidence strong enough to act on?

If the evidence is weak, say so. Don't file noise into the backlog.

### 5. Create or update work items

Use the azure-devops-task skill to file findings:

- Search for existing work items first — update if active, create if none
- Title: short, action-oriented, describes the fix not the symptom
- Description: include the evidence (exception counts, duration data,
  the specific code path) and a suggested fix
- One work item per distinct root cause, not per symptom
The point isn't to automate ticket spam. It's to make the boring part of incident triage consistent enough that the first pass is actually useful.
One case made this click for me. We had messages piling up in a dead letter queue and the first symptom in App Insights looked like the usual vague mess: MessageLockLost, scattered exceptions, lots of retries. On its own, that doesn't tell you much. Claude pulled the exception pattern from App Insights, checked the queue lock duration from Service Bus, then read the handler code in the repo. The problem wasn't some mysterious transient Azure issue. The handler was simply doing too much work for the lock window it had.
That's the sort of thing I'd normally figure out myself after bouncing between three browser tabs and the codebase for fifteen minutes. Here it happened in one flow. And when it filed the ADO item, it wasn't just "DLQ issue in production". It included the likely root cause, why the lock was expiring, and what kind of fix made sense.
That, to me, is the sweet spot for skills in Claude Code. Not new powers. Better defaults for recurring work.
CLI tools vs MCPs
MCP (Model Context Protocol) servers are the other way to give Claude access to external systems. They wrap an API in a typed interface that Claude calls directly, without going through a shell. There are Azure MCPs, GitHub MCPs, and plenty of others.
For cross-service investigation, the CLI wins. A few reasons.
The az CLI covers every Azure service. App Insights KQL, Service Bus queue counts, AKS events, resource graph queries, DNS lookups, DevOps boards — all in one tool you already have installed. An Azure MCP covers a subset. The moment you need something it doesn't have, you're stuck. During this session I hit nine different Azure services. No single MCP would have handled all of them.
The bash tool lets you combine az output with Python, shell loops, dig for DNS, kubectl for Kubernetes, whatever you need, in the same session. Tracking down which gateway sat in front of a public hostname took a plain DNS lookup, not an Azure API call. A typed MCP interface has no door for that.
You're also already authenticated. az login is done, subscription context is set. An MCP needs its own auth config, its own server process, and its own maintenance when the upstream API changes.
And iteration is faster. When a query returns something unexpected — wrong field type, missing data, a filter that silently drops results — you fix the command and re-run in seconds. With a typed MCP tool, you're at the mercy of how the tool author exposed the parameter.
The honest case for MCPs is narrower: well-defined operations where you don't need flexibility. Listing resources, triggering a deployment, looking up a specific record. For those, the structured output is genuinely nicer. But for open-ended investigation across multiple services, the CLI wins.
Short version: use MCPs when you know exactly what you need. Use CLI when you're figuring it out.
The prompts I actually used
The first session was before I had the skills. The prompts had to spell everything out:
"I want you to query appi-prd-myapp. Look at all the errors, dep errors and exceptions and suggest changes in the current code base."
"I want you to create user stories in devops, project MyProject in org my-org. In norwegian and humanize. Under the Area for MyArea and add 'Grooming' tag."
"Look at the DLQ for the service bus instance for my service in prd and look at the DLQ. Find the reasons why they are occuring by cross referencing app insights and suggest fixes for them."
They worked, but I was hand-holding. Every prompt had to include which resource, which org, which project, which area. The skills exist because I got tired of repeating that.
With the triage skill loaded, the same session starts with:
"Triage the latest failures for the booking service and file what needs fixing."
One sentence. Claude loads the triage skill, which pulls in the App Insights and ADO skills, and runs the whole workflow. It knows the resource names, the org, the project, the area paths, the output format, and when to stop and ask.
Filing a single finding mid-conversation is even shorter:
"Make a user story for this."
Five words. It picks up the context from what it just found, formats it, resolves the area path, and asks for confirmation.
I used the Humanizer skill alongside the ADO skill to strip out the AI-sounding phrasing Claude defaults to when writing prose. "In norwegian and humanize" in the original prompt did that manually — now the skill handles it.
What this is good for
It's not magic. Claude won't understand your domain better than you do, and it'll miss context that lives outside the telemetry — business rules, known infra quirks, things that were deliberately configured a certain way.
But it's good at the mechanical part. Running the right queries, correlating across systems, writing up findings in a consistent format, filing the tickets. That's usually 80% of the work in a monitoring review. Deciding what's worth fixing, prioritising, knowing which "errors" are actually expected — that still needs you.
A pair programmer who's fast at Azure CLI and patient enough to iterate on KQL queries at 7am on a Friday. That's roughly what you get.